
Reverse Engineering

Engine-Level Browser Instrumentation: Observing Below JavaScript

By the Scrappey Research Team

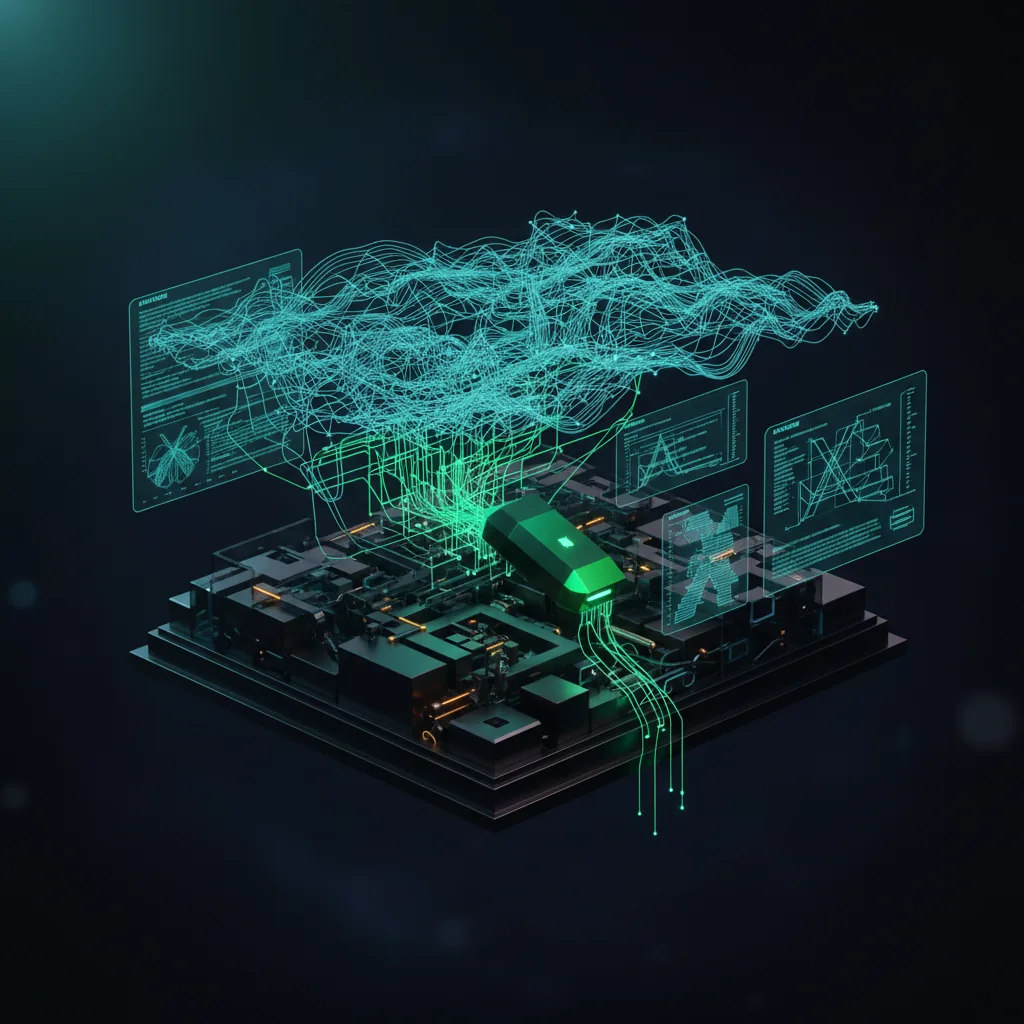
Engine-Level Browser Instrumentation: Observing Below JavaScript — conceptual illustration
On this page

Engine-level instrumentation means adding observation points inside the browser's C++ rendering engine (Blink), below the JavaScript layer, instead of patching functions in JavaScript. Because the hook lives in native code that runs during the implementation of an API like HTMLCanvasElement::toDataURL(), the JavaScript function the page sees is completely unmodified. There is no wrapper, no source-string tell, no descriptor change -- so observing it does not change what the page's scripts do.

Quick facts

LayerChromium Blink engine (C++), below JavaScript
MechanismBlink probe system + a custom CDP domain
JS-visible traceNone -- the native function is untouched
CostForking and compiling Chromium
Why it helpsAvoids the toString, descriptor, and name tells at once

How a probe is wired in

Blink ships an instrumentation framework -- the "probe" system. A method like HTMLCanvasElement::toDataURL() is edited to call a generated hook such as probe::DidCanvasToDataURL(...). The probe definitions live in files like core_probes.pidl/core_probes.json5, and a custom inspector agent receives the call and forwards it as a DevTools event. None of this exists in the JavaScript world: the page calls the same toDataURL it always did, and the native implementation quietly reports the call on the way through.

A custom CDP domain

To surface the observations, you define a new CDP domain -- the post calls its example "Snitch" -- in browser_protocol.pdl, with commands and events. You implement an agent (e.g. SnitchAgent, inheriting InspectorBaseAgent), register it in WebDevToolsAgentImpl::AttachSession, and emit events like Snitch.toDataURLCalled from the probe. A UI -- in that project, an Electron shell -- subscribes to those events and shows every canvas fingerprinting attempt as it happens, across every frame including out-of-process iframes.

Why it leaves no JavaScript-visible trace

Every JavaScript-level approach -- content scripts, CDP pre-load injection, per-frame hooks -- leaves a function that differs from native under a toString or descriptor check. Engine-level instrumentation sidesteps the entire class because it never creates a JavaScript artifact to inspect, so studying a script does not change how it behaves. The same below-JavaScript principle explains why coherent, real-machine browser tooling is built at the engine layer rather than scripted on top: a believable fingerprint comes from one real machine, not a pile of per-field edits that lie detection can pull apart. A managed web-data API takes on that engine-level work so you do not have to fork and compile Chromium yourself.

Code example

cpp
// Blink, third_party/blink/renderer/core/html/html_canvas_element.cc
String HTMLCanvasElement::toDataURL(const String& mime_type,
                                    const ScriptValue& quality,
                                    ExceptionState& exception_state) const {
  // Engine-level observation point -- fires during the native impl.
  // No JavaScript wrapper exists, so the page sees an untouched toDataURL.
  probe::DidCanvasToDataURL(GetDocument().GetExecutionContext(),
                            this, mime_type);
  return ToDataURLInternal(mime_type, quality, kBackBuffer);
}
// The probe forwards to a custom CDP agent, which emits e.g.
// "Snitch.toDataURLCalled" to a UI subscribed over the DevTools socket.

Related terms

Concept map

How Engine-Level (Blink) Browser Instrumentation connects

The terms most directly tied to this one. Hover a node to see its neighbours, click to preview, drag to rearrange.

0 terms · 0 connections
You are here · Reverse Engineering
Building map…

Frequently asked questions

Why does engine-level instrumentation leave no trace when JS hooks do?

Because no JavaScript object is replaced. The observation lives in the engine's C++ implementation, so the function the page inspects is the genuine native one -- correct toString output, name, and descriptor. There is nothing in JavaScript that reveals the observation.

What is the Blink probe system?

It is Chromium's built-in framework for emitting instrumentation events from inside Blink. Engine methods call generated probe functions (defined in core_probes files) that forward to inspector agents, which surface the data over the DevTools protocol.

Do I have to fork Chromium to do this?

For your own observation tooling, yes -- you edit and recompile Blink. For automation, the practical alternative is to use a browser or managed API that already does the engine-level work, so you get a coherent native fingerprint without maintaining a Chromium fork.

Last updated: 2026-06-09