
You've got two scraper setups, one dashboard says it's faster, and your pipeline is still missing records by morning. That's the usual reason teams start benchmarking, not curiosity about speed. They need to know what a usable result costs.
What Performance Benchmarking Means for Web Scrapers
Two runners timed on different tracks, in different weather, from different starting points tell you nothing about who's faster. Most scraper comparisons work the same way. One run hits easy static pages on a warm cache, the other hits JavaScript listings through a distant proxy, and the averages get compared as if they measured the same thing.
Performance benchmarking is a repeatable test of a system under a defined workload, producing numbers you can compare across versions, providers, or environments. A scraper that finishes 10,000 pages quickly by skipping challenged pages hasn't become faster. It's changed what it counts.
Scraping is harder to pin down than a single-machine test because the other side moves. Target sites change markup, JavaScript rendering adds variable time, challenges appear without warning, and proxy geography changes both latency and what content you see. Your harness controls only half the experiment.
That's why the old principle still applies. The Standard Performance Evaluation Corporation timeline notes SPEC was founded in 1988 to replace inconsistent or poorly representative system tests with repeatable workloads that could support fairer comparisons across vendors. Credible results depend on standardized workloads, defined reference systems, repeatable procedures, and transparent reporting, not headline specifications.
What follows is the practical version for scrapers. You'll pick metrics that can't hide failures, build a workload that matches production, run it under control, and only then decide whether a difference is real.
Five Core Metrics and How to Calculate Each
| Metric | How to Measure It | Healthy Reading | Common Trap |
|---|---|---|---|
| Throughput | Successful responses divided by wall-clock minutes at fixed concurrency | Stable across repeated runs and rising with concurrency until the saturation knee | Counting failed or challenged responses as completed work |
| Latency | Time from request to usable response, reported as p50, p95 and p99 | p95 does not drift between runs; target set from your own baseline | Reporting only the mean |
| Error rate | Failed requests divided by total requests, grouped by error type | Low and stable per class: timeouts, 4xx, 5xx, resets | Retries hide first-attempt failures |
| Success rate | Attempts returning valid output divided by total attempts | Measured against your extraction schema | HTTP 200 responses that contain challenge pages |
| Resource use | CPU, memory and bandwidth per 1,000 requests | Memory flat across the run; browser instances do not accumulate | Measuring only the client machine and ignoring the target |
| Cost per successful result | Total spend divided by valid outputs | Falls as success rate rises at equal latency | Comparing price per request instead of price per success |
Throughput only counts successful responses. If you count every completed HTTP exchange, a system that fails fast looks productive. Divide valid responses by wall-clock minutes at a stated concurrency, and keep that concurrency fixed when you compare candidates.
Latency runs from request start to usable response, not to first byte and not to connection close. Report p50, p95, and p99. The median tells you the typical page, the tail tells you what your downstream jobs wait on, and the mean blends both into a number nobody experiences.
Splitting failures from successes
Error rate is failed requests divided by total requests, split by class. Timeouts behave differently from 4xx responses, 5xx responses, and connection resets, and each points to a different fix. If timeouts dominate, read up on setting Python request timeouts for reliable scraping before you blame the target. Always log first-attempt failures separately, because retries can turn a bad first pass into a decent final number while doubling your cost.
Success rate is stricter than status codes. An attempt counts only when the output passes your extraction schema, with required fields present and plausible. An HTTP 200 holding a challenge page is a failure, and any benchmark that counts it as success is measuring politeness, not data.
Resource use is CPU, memory, and bandwidth per 1,000 requests on the machines you run. Memory should stay flat across a long run. If it climbs, you've got leaked browser instances or unbounded queues, and your throughput number will collapse in production long after the benchmark ends.
Cost per successful result ties it together. Divide total spend, including retries and proxy or browser costs, by valid outputs.
Practical rule: A metric is only meaningful next to the success rate that produced it. Fast and cheap mean nothing if the output fails your schema.
Building a Workload That Matches Your Targets
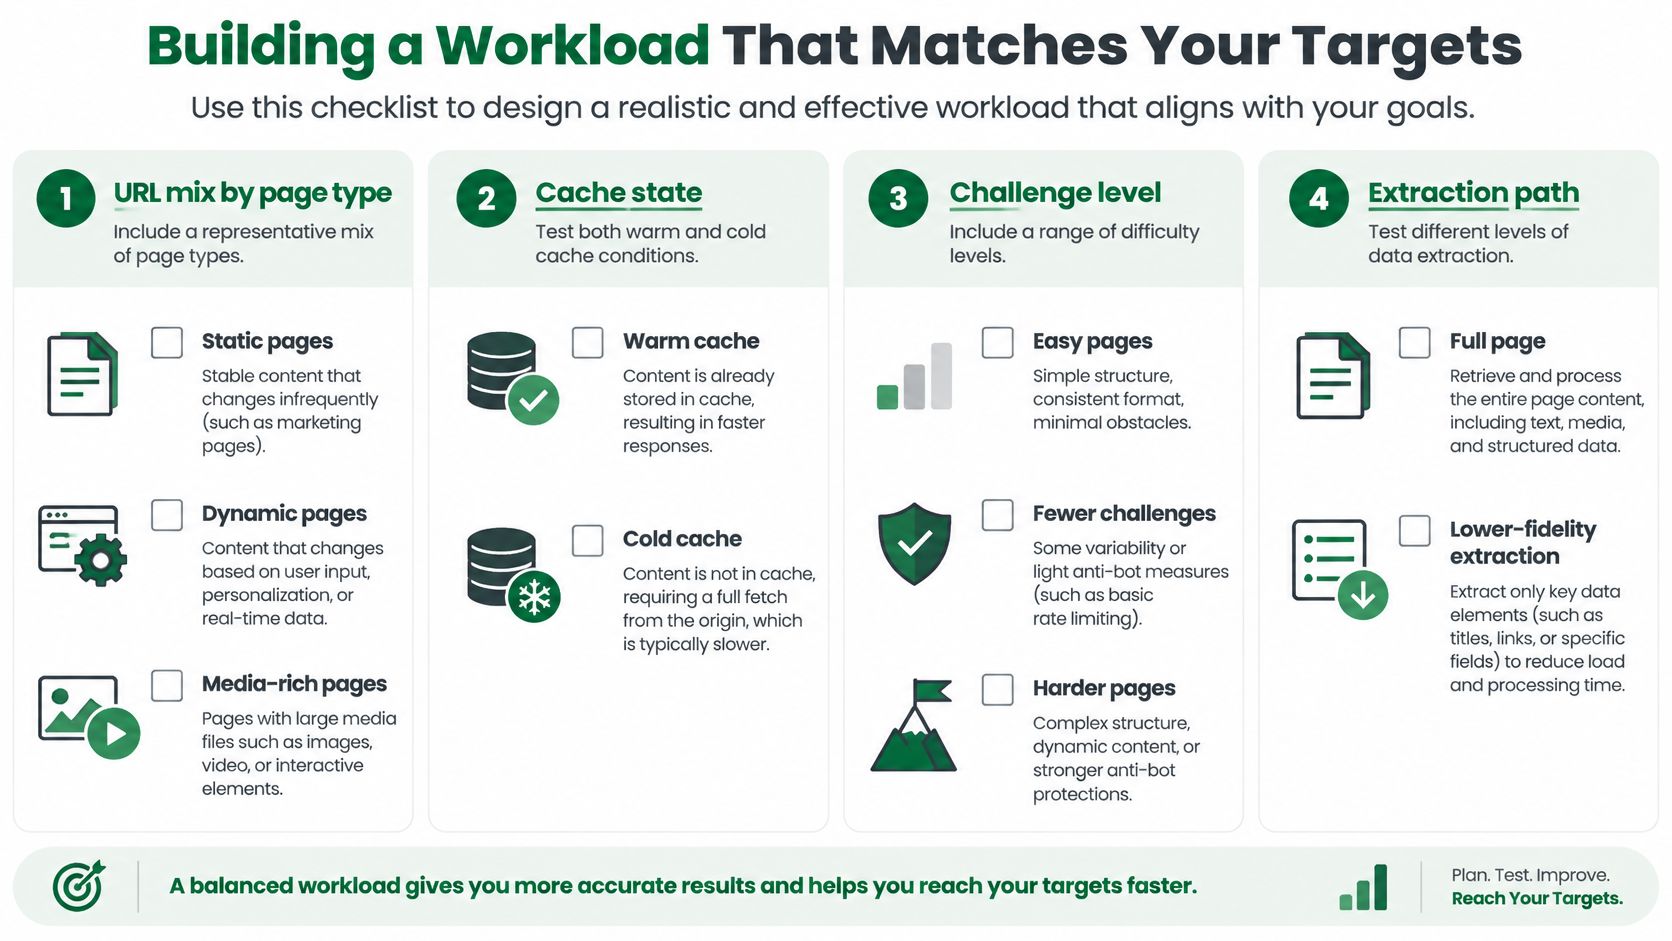
A faster result can reflect easier pages, warmer caches, fewer challenges, or a lower-fidelity extraction path. Your workload has to rule those out before you run anything. Build it as a checklist, with shares taken from production logs rather than guesses.
- URL mix by page type: Split static pages, JavaScript-heavy listings, detail pages, and API endpoints in production proportions.
- JavaScript complexity: Flag pages that need hydration or client-side calls before data appears.
- Response size: Record payload size per page type, since large pages change transfer time independent of server speed.
- Concurrency levels: Test at set levels such as 5, 20, and 50 parallel workers rather than one arbitrary setting.
- Cache state: State cold or warm for each run, because warm caches flatter every candidate.
- Geographic targets: Fix proxy routing and target region, since geography changes latency and content.
- Success criteria: Name the exact fields that must be present for an output to count as valid.
Separating single-task speed from capacity
Elapsed time measures how fast one task completes, while throughput measures completed work per unit time, and the SPEC CPU 2026 overview formalizes this through SPECspeed, which evaluates time to complete individual tasks, and SPECrate, which evaluates throughput across multiple tasks. Keep those separate in your report. Publish page-level median and tail latency on one line and sustained successful responses per minute on another, alongside error and challenge rates.
Collapsing both into one average hides the trade-off you'll manage. A setup can win on single-page speed and lose badly once you run it at production concurrency.
Prove the workload stayed fixed by hashing the URL list file and storing that hash with every result set. If the hash changes, you're running a different benchmark, whatever the spreadsheet says.
Choosing Direct HTTP or Full-Browser Mode to Test
| Mode | What It Executes | Best Revealed By | Trap to Avoid |
|---|---|---|---|
| Direct HTTP | One HTTP request with headers, no JavaScript | Raw latency and throughput for static pages and API endpoints | Pages that return HTML shells while the data loads through JavaScript |
| Full browser | Real browser instance with JavaScript, rendering and page actions | Time to usable content and challenge handling | Browser startup and rendering time mixed into page latency |
| Mixed pipeline | HTTP first, browser on failure | Cost per successful result and end-to-end success rate | A low fallback rate reported without the browser latency it hides |
The same URL fetched two ways isn't one workload. Direct HTTP sends a request with headers and never runs JavaScript, so it's the right test for static pages and API endpoints where the payload arrives complete. Its trap is the empty shell. The request returns quickly, your latency looks great, and the data was never in the response.
Full-browser execution runs a real browser with JavaScript, rendering, and page actions. If you're setting that up yourself, a guide to the Chrome headless browser for web scraping covers the operational basics. Benchmark it on time to usable content and challenge handling, and log browser startup separately so launch cost doesn't get blamed on the page.
Testing the mixed pipeline honestly
Run three benchmarks, not one. Test direct HTTP alone on the fixed URL list, test the browser alone on the same list, then test the mixed pipeline as its own product. Report the mixed pipeline's fallback rate, the share of URLs where HTTP failed and the browser took over.
That rate is where the money hides. A high fallback rate means your cheap path is mostly failing, and the pipeline's average latency includes the expensive browser path you thought you were avoiding. A low average with an undisclosed fallback rate tells you nothing.
I would pick the mode that delivers the most valid outputs per unit of time and spend on your URL mix. The lowest latency wins only when the outputs are equally valid, which is exactly what the separate runs let you check.
Tooling and Automation for Repeatable Runs
Pick tooling layer by layer, and judge each piece by whether it records raw events. A tool that prints only averages can't support the variance checks you'll need later.
- Load generation: Use a script or open-source load tool that sends requests at randomized intervals with fixed concurrency, so one harness drives every candidate identically.
- Browser control: Drive a headless browser through an automation library and pin the browser version, recording it with each run so an update can't shift results mid-series.
- Metrics collection: Write one JSON log line per request as the run progresses, and sample host CPU, memory, and network every few seconds alongside it.
- Automation: Run pilot, steady-state, and concurrency-sweep phases from a CI job or scheduled task, store the URL list hash with each result set, and fail the run when resource checks fail.
- Analysis: Compute p50, p95, p99, coefficient of variation, and confidence intervals from raw logs in a notebook or script, then render one comparison table per candidate.
Benchmarking integrates with your regular pipeline work. If you've already invested in automating web scraping for scalable data pipelines, reuse the same scheduling and storage instead of building a throwaway test rig you'll never rerun.
Two details matter more than brand names. Your tooling must expose the random seed used for timing, so a schedule can be replayed exactly. It must also let you pin versions of the browser, libraries, and harness itself.
Keep the workload file, harness code, and host type identical across candidates. If any of those change between runs, you can't tell whether the difference came from the system under test or from your own setup, and the whole comparison is wasted effort.
A Sample Test Plan and Harness Setup
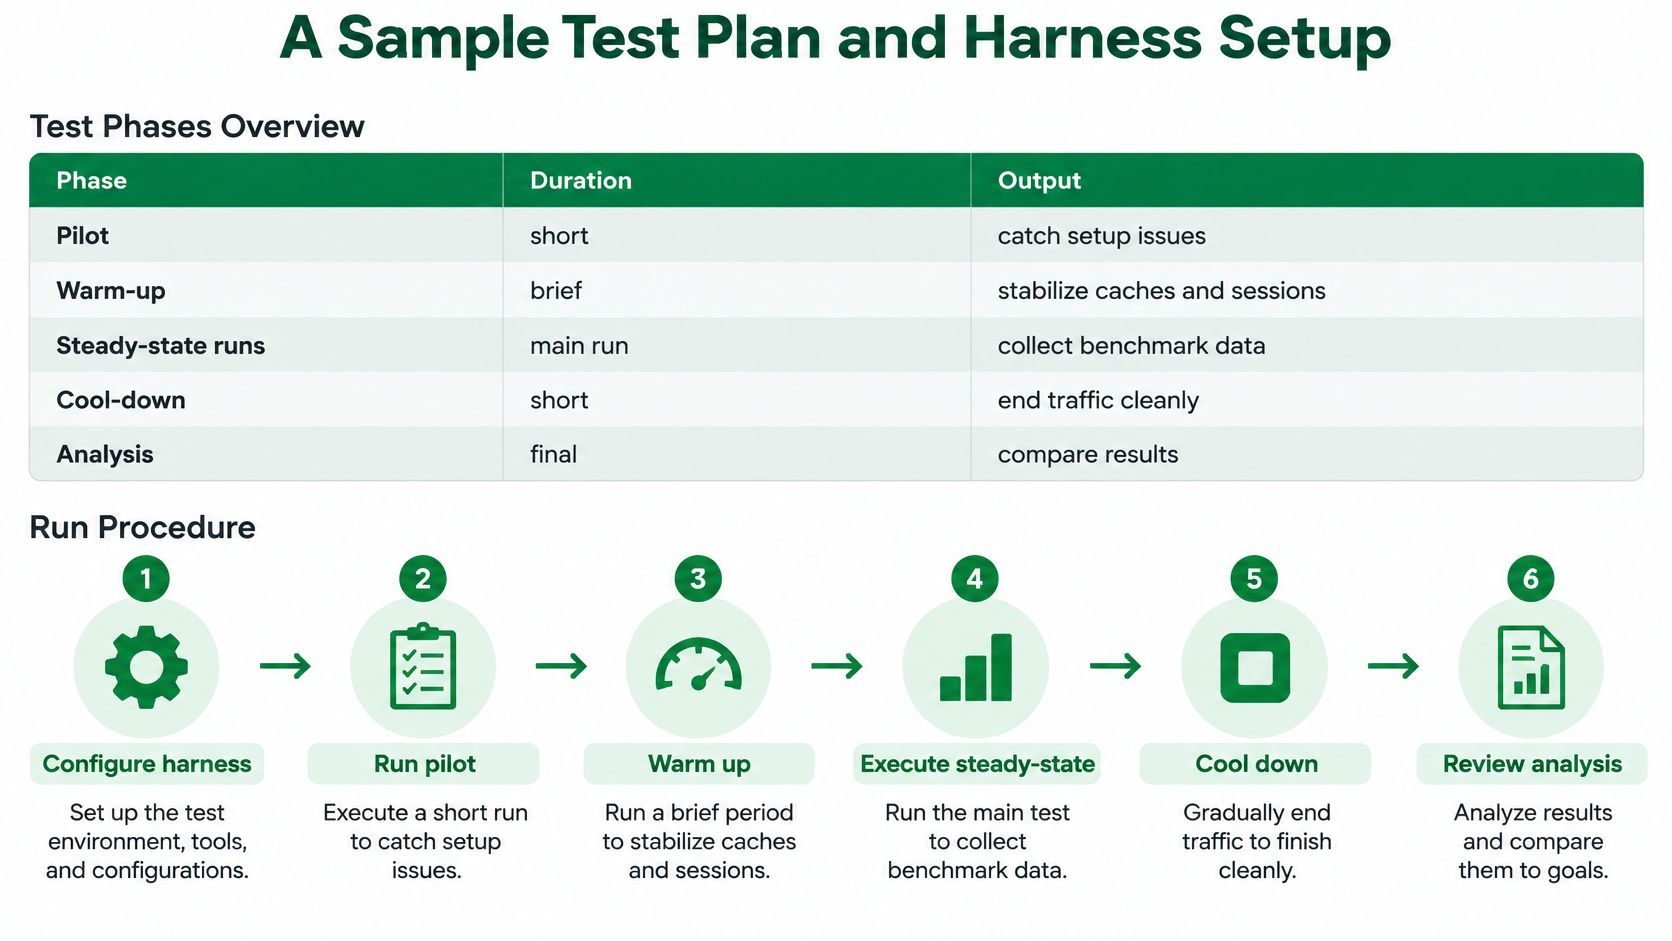
| Phase | Action | Duration | Output |
|---|---|---|---|
| Pilot | Run 50 to 100 URLs three times at fixed concurrency | One day | Coefficient of variation per metric |
| Warm-up | Send traffic and discard the first window | 15 minutes | Steady-state starting point |
| Steady-state runs | Fixed workload mix, randomized timing, three to five repetitions | 2 to 4 hours per run | Raw per-request log for each run |
| Concurrency sweep | Repeat the workload at 5, 20 and 50 workers | Half a day | Throughput and p95 at each level |
| Cool-down and checks | Confirm memory is flat and no browser instances leaked | 30 minutes | Pass or fail on resource checks |
| Analysis | Compute summaries from raw logs only | One day | Table of metrics with dispersion |
Running the test in order
- Pilot first: Run 50 to 100 URLs three times to measure variance before you commit to full runs.
- Fix the workload: Freeze the URL list and store its hash with the configuration.
- Warm up, then discard: Send traffic to stabilize caches and sessions, and throw that window away.
- Randomize timing: Vary request intervals rather than sending perfectly periodic arrivals.
- Repeat steady state: Run three to five repetitions with identical settings.
- Record everything: Log CPU, memory, network, browser version, proxy geography, concurrency, and challenge outcomes per run.
- Save raw results: Write per-request logs to disk before computing any summary.
The timing point deserves emphasis. The SPEC power and performance methodology recommends varying request cycle times, such as with a negative-exponential distribution, to avoid harmonic amplification caused by perfectly periodic arrivals. Use an exponentially distributed delay, not uniform jitter, and log the seed so the schedule can be replayed.
A short Node.js harness is enough. It reads the URL list, sends requests at randomized intervals with fixed concurrency, and writes one JSON line per request holding status, validity flag, latency, and attempt count. At the end it computes p50, p95, and p99 from those lines.
The script is only as good as the controls around it. Identical starting state, explicit metric definitions, and fair comparison rules matter more than clever code.
Report dispersion, not just the mean, because a handful of slow or failed requests can wreck pipeline yield. Include successful responses per minute, valid-output rate, retry count, and cost per successful result so another tester could recreate the run and reach the same conclusion.
What to Benchmark When Testing Scrappey
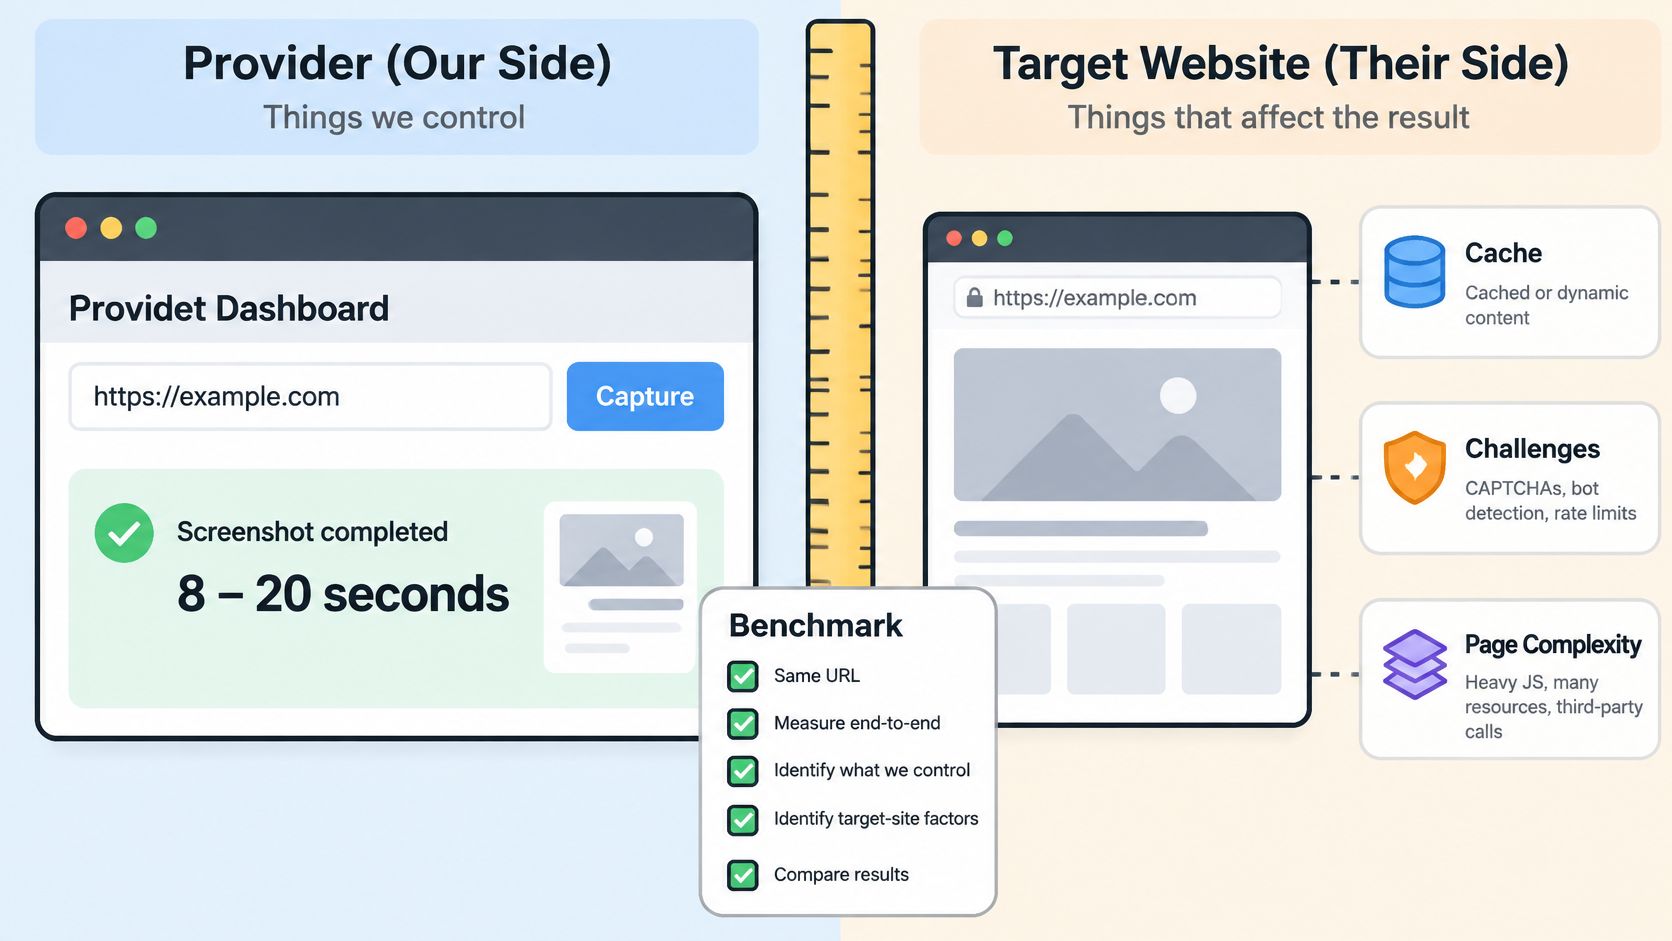
A provider benchmark has to separate what the provider controls from what the target site controls. Page weight, hydration time, and verification flows belong to the target. Browser execution, proxy routing, and retry handling belong to Scrappey.
Use concrete timings as your reference points. Typical full-browser screenshot calls on Scrappey return in 8 to 20 seconds depending on page weight, JS hydration time, and whether browser verification workflows must be completed, with time-to-first-byte reported as timeElapsed. Report your results by page type against that kind of range. One heavy product page should not be blamed on the platform, and one trivial static page should not flatter it.
The API is optimized for fast response time, even with JavaScript-heavy websites and browser verification flows. Test that claim on your own URL mix, including the pages that currently fail. A demo page chosen to look good tells you nothing about production yield.
First attempts, retries, and saturation
Scrappey uses intelligent retry logic, residential proxies, and reliable web access handling to maximize success rates. That design means your benchmark must record first-attempt success separately from final success. Final success tells you what your pipeline receives. First-attempt success tells you how much retry work, time, and spend produced it.
Averages hide saturation. Watch p95 as you raise concurrency, segmented by page type, geographic target, and workflow complexity. The concurrency level where p95 starts to climb while the median looks flat is your practical capacity limit. Record it.
Judge each concurrency level on three numbers together. Success rate, tail latency, and cost per successful result answer what a usable result costs. Adding concurrency can make per-request latency look worse while lowering cost per valid output through higher throughput. That tradeoff is the decision.
Reading Results Without Fooling Yourself
A single run with a better average is the most common way teams fool themselves. Targets drift during the day, proxies rotate, and one lucky run becomes a migration decision. Before you believe any number, run three checks on every metric.
- Compare median with p95: If the median improves but p95 doesn't, the tail that governs your job completion times hasn't moved.
- Calculate the coefficient of variation: Divide the standard deviation across repetitions by the mean to see how noisy the metric is relative to its size.
- Compute a confidence interval: Put bounds around the mean or median so you can see whether two candidates separate.
How much repetition is enough
The honest answer depends on the size of change you're hunting. A longitudinal study of stream-processing benchmarks ran 2,366 experiments across 789 AWS Kubernetes clusters over roughly three months and found application-level variability below 3.7%, with daily and weekly effects no larger than 2.5%. For decisions seeking changes larger than 5%, exact execution timing may matter relatively little.
Don't generalize that to scraping. The finding is workload-specific, and it shouldn't be stretched to noisy network, storage, serverless, or tail-latency measurements, which is most of what a scraper benchmark touches. Earlier cloud-network research in that same discussion found some big-data benchmarks required 70 or more repetitions to obtain a 95% confidence interval within 1% of the median. Web targets add challenge randomness on top of network noise, so expect your variance to sit closer to the noisy end.
Variance first: Run pilots, measure the coefficient of variation, then set a stopping rule based on the smallest improvement worth shipping. Don't pick a run count out of habit.
That protocol changes the question from "how many runs" to "how many runs for this workload, this metric, and this minimum detectable improvement." If your pilot shows tight variance and you're testing a large change, a few repetitions settle it. If variance is wide and the expected gain is small, keep running or accept that the benchmark can't resolve the difference. Success rate, latency, extraction completeness, and cost per successful result fluctuate independently, so apply the stopping rule per metric. The noisiest metric sets your run count, not the calmest one.
Decide Whether a Gain Is Real Before You Switch
A faster median means little if the usable result costs more. Judge every candidate on success rate, tail latency and cost per successful result together, using the same URL set.
Run four checks before you act on any result.
- Beat your own noise: The gain must clearly exceed the variation measured in your pilot. A small shift buried inside a wide spread is noise, even when the dashboard colors it green.
- Hold success steady: Success rate and valid-output rate must not drop. A faster system returning fewer usable results is a regression.
- Compare cost per success: Use cost per successful result under identical workloads, never price per request.
- Make it reproducible: Another tester must be able to rerun it from your URL list hash, browser version, concurrency, proxy geography, and timing method. Our free Browser Environment Inspector helps you inspect browser environment signals when results look environment-dependent.
A gain that fails any check is not a gain yet. Keep the benchmark to publicly available pages, since Scrappey is designed for accessing publicly available web data and powering automation workflows, and document that scope in the report. Save the report template and rerun it against each candidate before you switch.
Run your fixed URL list against Scrappey in both direct HTTP and full-browser mode, log first-attempt and final success separately, and compare cost per successful result against your current setup on identical workloads. Visit Scrappey to start a free trial and put real numbers on the decision instead of trusting anyone's headline speed.