

You have a spreadsheet of 4,000 rental listings pulled from three portals, and a question from your asset manager that fits in one line: hold rent flat this quarter, or push it 4%? The spreadsheet won't answer that. Half the rows repeat the same unit under different listing IDs, the two-bedroom you care about shows up at three prices, and nothing in the file records the six weeks of free rent a competitor is advertising two blocks away.
That gap between the number in the listing and the money a landlord collects is where rental market analysis earns its keep. Most guides stop at the median asking rent for a metro area, and that figure describes almost nobody's building.
What follows is the workflow I run, in the order it has to run: the formulas, the data gaps that break it, and the places where a clean number still misleads you.
How the Rental Market Analysis Workflow Fits Together
Two buildings on the same street, same district, same tenant profile. The owner lists her units 8% above what neighbouring landlords are asking and watches them sit empty for six weeks. Nothing is broken in the building. The gap sits in the analysis she never ran: what the nearby landlords collect after concessions, and what demand looks like at that price point in that district right now.
Rental market analysis exists to close that gap, and it runs as a sequence rather than a report, because each stage constrains the next.
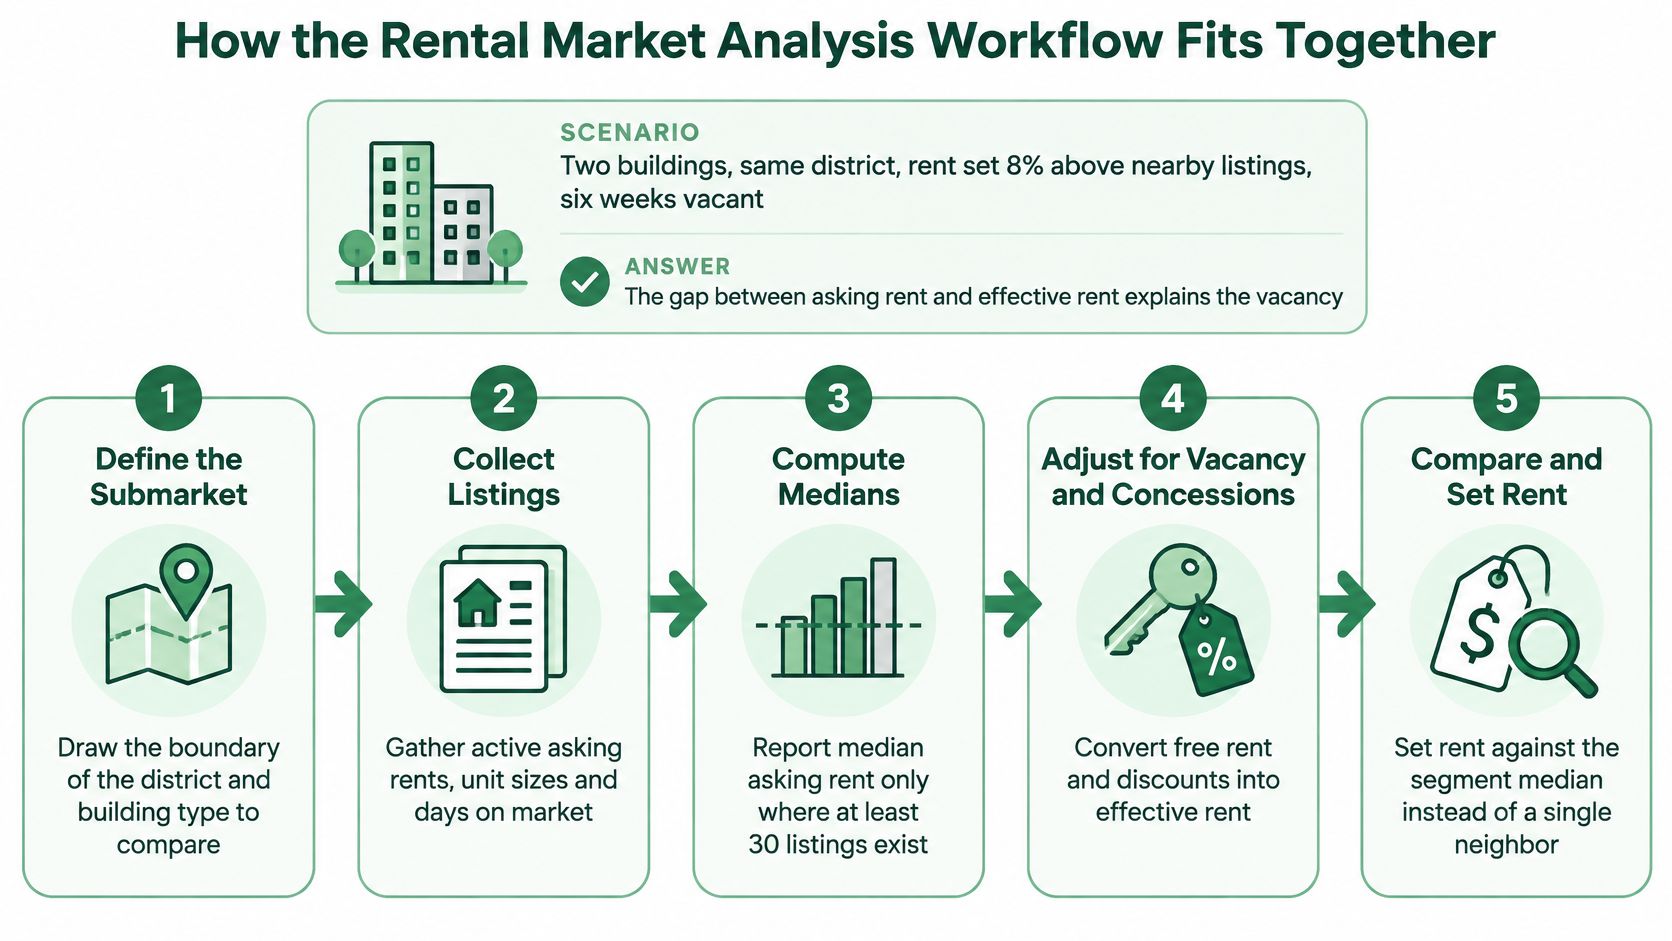
- Set the decision and the KPIs. One question, three to five metrics, written down before you touch a scraper.
- Choose data sources. Portals, manager sites, official surveys, your own leases. Each one covers a different blind spot.
- Collect listings. A weekly job that writes one row per listing, with a timestamp.
- Clean and enrich the records. Deduplicate, normalise, geocode, attach income and age context.
- Compute the metrics. Medians, rent per square metre, vacancy, effective rent.
- Model pricing and write the report. A target range, three scenarios, one page of recommendation.
- Act on it and re-run on a schedule. Pricing decisions happen once; monitoring never stops.
The most common mistake is starting at stage three. Teams spend weeks scraping before deciding what question the data must answer, then discover that half the fields they collected can't feed any metric.
Three rules that hold throughout: one decision per analysis, neighbourhood-level geography rather than a whole city, and at least twelve months of history before you claim a trend.
Note which stage you're at now. The rest of this follows the same order.
Define the KPIs That Answer Your Question
Three decisions drive most of this work, and each needs a different metric set.
Pricing a single unit. You're placing one number against matched comparables: median asking rent for the same bedroom count and size band, plus rent per square metre so a compact unit isn't measured against a large one.
Deciding whether to buy a building. You're underwriting income durability, so vacancy, twelve-month rent growth and days on market carry more weight than today's asking rent.
Judging whether a submarket is tightening. Asking rents can hold while concessions pull effective rents down, so the signals are concession share, effective rent and rent-to-income.
Definitions come before collection, because two analysts can pull the same listings and publish numbers that disagree without either being wrong about anything except what "asking rent" means. A median only means something when the units inside it are matched by bedroom count, size band and building age. A city-wide median mixes studios with three-bedroom penthouse conversions and gives you nothing to price against.
Geography is where most headline numbers fall apart. Zillow's May 2026 rent report found that 74.1% of U.S. rental listings were affordable to a median-income household, yet only 33.4% of New York listings and 43.6% of Los Angeles listings met the same bar, and just 8.8% of listings nationally were priced below $1,000 (Zillow rent report). One national share hides both extremes.
| Metric | How to calculate it | Decision it informs |
|---|---|---|
| Median asking rent | Middle value of listed rents for matched units | Where your price sits in the market |
| Rent per square metre | Monthly rent divided by floor area | Comparing units of different sizes |
| Vacancy rate | Vacant units divided by total rental stock | How tight the market is |
| Days on market | Days from first listing to removal or lease signing | How fast demand absorbs supply |
| Concession rate | Share of listings offering free rent or other incentives | Whether asking rents overstate real prices |
| Rent-to-income ratio | Annual rent divided by gross household income | Affordability for the target renter |
Two settings control the whole dataset. Report at postcode or neighbourhood level, never at metro level, because a metro median describes a market nobody operates in. Snapshot listings weekly and compute medians monthly, and keep every raw snapshot, so a later change in how you define a comparable doesn't destroy your history.
Exercise: write your question as one sentence, then pick three to five KPIs that answer it. A sixth metric usually means you haven't decided what the report is for.
Choose Sources and Collect Listings Safely
No single source covers both asking rents and effective rents, so you combine them and note what each one misses.
| Source | What it gives you | Main gap |
|---|---|---|
| Listing portals | Volume, fresh asking rents, unit detail | Misses leases that never list; duplicates across sites |
| Manager and landlord sites | Real availability for specific buildings | Narrow coverage; asking prices only |
| Census and housing surveys | Official vacancy and rent benchmarks | Released quarterly or annually; coarse geography |
| Government and OECD datasets | Affordability and income context | Slow updates; limited unit-level detail |
| Your own lease records | Effective rents and actual vacancy | Hard to access; limited to your portfolio |
Portals win on volume and freshness. They lose on the leases that never get advertised, which is why a submarket can look like it has 40 available units when the true number of move-ready vacancies is twice that. Manager and landlord sites fill the gap for specific buildings you're tracking, usually with the actual concession terms printed on the page.
Then the collection itself, in order.
- Read robots.txt and the terms of service before the first request. Decide now what you're allowed to store and redistribute, because changing your mind after 40,000 records is expensive.
- Fix your field list. Listing ID, URL, postcode, bedrooms, bathrooms, floor area, monthly rent, deposit, fees, utilities included, first-seen date, status. Everything downstream depends on these being captured from day one.
- Throttle and cache. A few requests per second per host, with pages stored locally, keeps a weekly refresh polite and lets you re-parse old HTML when your field definitions change.
- Store the raw response with a timestamp. Auditing a number three months later requires the original HTML, not your parsed version of it.
- Run it weekly and append. One row per listing per snapshot, never an overwrite.
The script pattern is deliberately dull: loop over search pages, call requests.get(page_url) with a normal user agent, hand the HTML to a parser, pull the price string and bedroom count out with a regex, and append a row to a CSV through csv.DictWriter with today's date attached. When a site renders prices in JavaScript, the same loop needs a headless browser, which is where a scraping API earns its cost against maintaining Playwright yourself. If you'd rather buy that layer than build it, this roundup of real estate data APIs compares the options.
Legal boundaries are not optional. Avoid collecting landlord names and phone numbers unless you have a lawful basis, apply GDPR whenever EU residents' data appears in a listing, never bypass a login or paywall, and check licence terms before you resell or republish anything you gathered.
Clean and Enrich Listings Into an Analysis Dataset
Raw listings aren't a dataset. They're a pile of strings with prices attached, and every metric downstream inherits whatever this step misses.
- Deduplicate first. Match on address, unit number and listing ID. Portals repost the same unit under fresh IDs every few weeks, and the same agent lists it on three sites.
- Normalise rent to one monthly figure in one currency, and record whether fees and utilities are included. A weekly quote and a monthly quote sit identically in a spreadsheet column until you label them.
- Screen outliers with a segment test. Compare each record with the median for its bedroom count and neighbourhood, then send anything more than 40% away to manual review. A two-bedroom far below the segment median is usually a room share or a deposit figure, not a rent.
- Standardise the unit fields. Bedrooms as integers, floor area in square metres, bathrooms as decimals. Free text like "2 bed / 1 bath / XXL" destroys any grouping you attempt later.
- Geocode to a neighbourhood or census tract, not to a postcode centroid. A centroid puts a waterfront building in the wrong submarket and skews the median.
- Enrich each record with tract-level income, population and year built, so rent-to-income and building age become computable rather than aspirational.
- Log status changes. Days on market exists only if you keep first-seen and last-seen dates. Without them, every listing looks like it leased instantly.
The duplication slip that inflates supply
Count one unit listed three times as three units and you've just added phantom supply to the market. Vacancy estimates rise, days on market fall, and the model tells you the submarket is softening when it isn't. The error compounds: a vacancy proxy built on duplicated records will disagree with the official survey, and analysts then blame the survey.
Before computing a single metric, run two checks. Compare your record count per neighbourhood with the portal's own result totals, and hand-inspect twenty listings against the live pages. A data validation checklist belongs inside the pipeline as a scripted test, not in a reviewer's memory, because the check gets skipped exactly when a deadline is tight.
Compute Medians, Vacancy and Effective Rent
A segment with 30 listings can support a more stable median than one with a handful, but the cutoff is a working rule, not proof that the sample represents the market. Report the listing count beside the median asking rent, and split results by property type and submarket. Median is less sensitive than mean to a small number of unusually expensive units, while rent per square metre helps compare homes of different sizes.
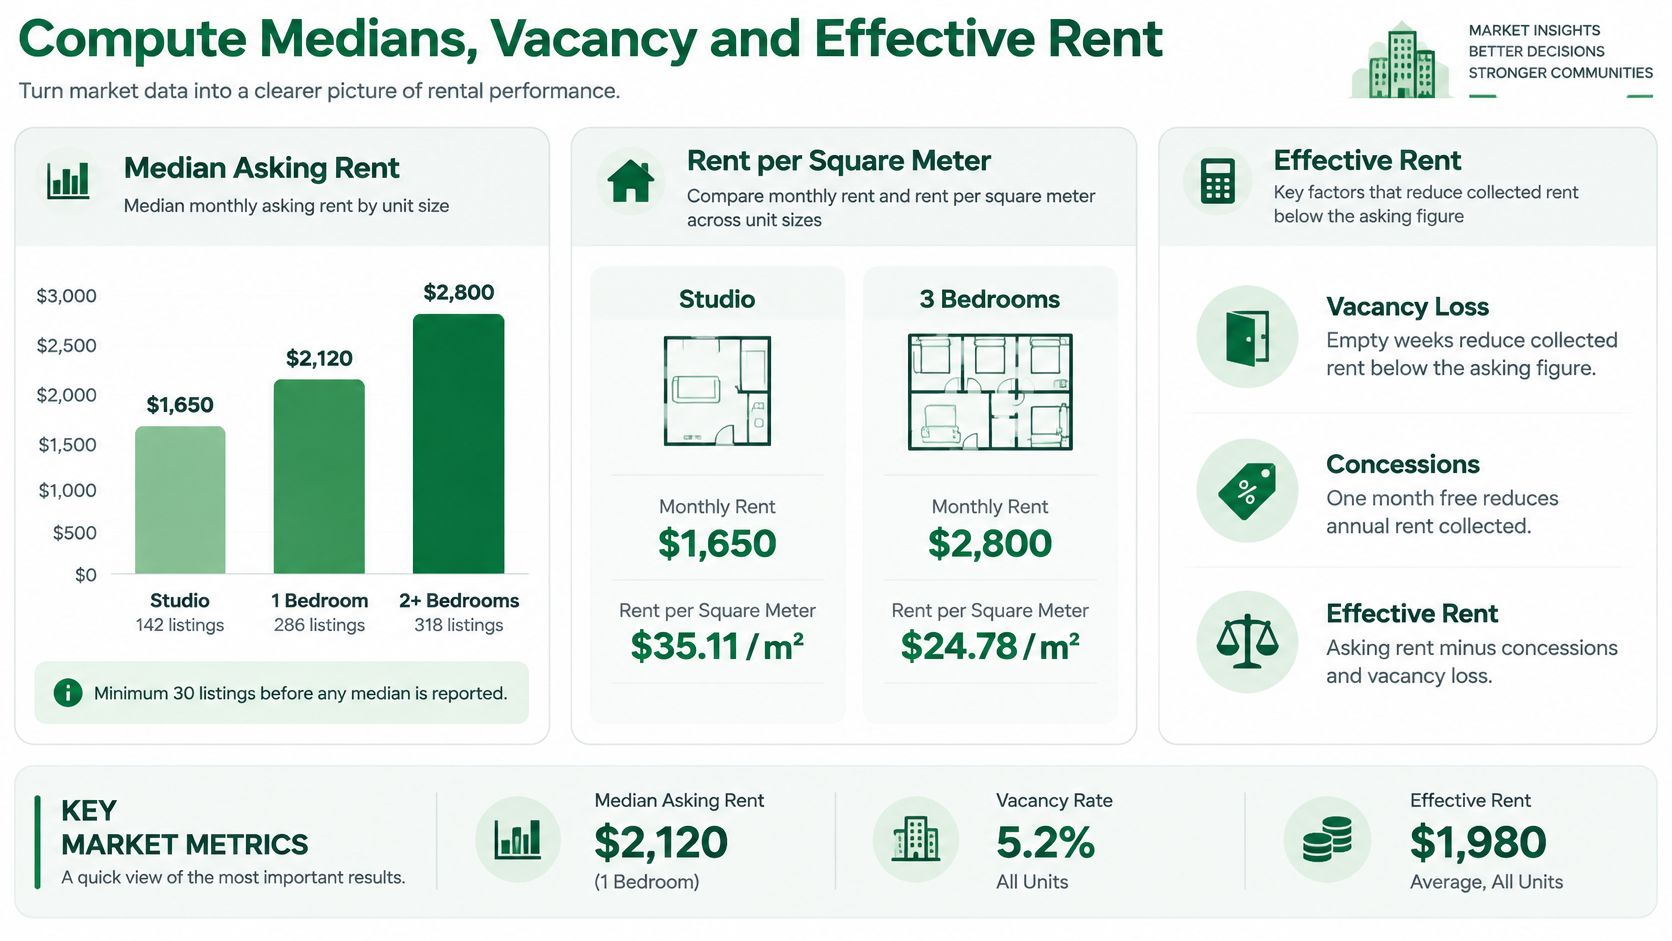
Listing data shows advertised availability, not the full housing stock. A listing-based vacancy proxy divides units advertised as available by an estimated total stock for the same segment. Treat it as an estimate and compare it with an official survey before using it in a report. The U.S. Census Bureau reported a 7.2% national rental vacancy rate, 9.1% in the South, and a median asking rent of $1,464 for vacant units available for rent in its fourth-quarter 2025 release (Census Bureau vacancy and homeownership release). Use national figures as a reasonableness check, not as a local estimate.
| Benchmark | Value | Use it to |
|---|---|---|
| National rental vacancy rate | 7.2% | Sanity-check listing-based vacancy estimates |
| South rental vacancy rate | 9.1% | Compare with Southern submarkets |
| Midwest rental vacancy rate | 7.2% | Compare with Midwest submarkets |
| Homeowner vacancy rate | 1.2% | Contrast with rental vacancy |
| Median asking rent for vacant units | $1,464 | Sanity-check asking rents, not estimate a city's rent |
| Cost-burden threshold | 30% of income | Flag rent-to-income ratios |
Effective rent captures concessions that asking-rent medians miss. An apartment advertised at $2,400 a month with one month free on a twelve-month lease brings in $26,400 over the year, or about $2,200 per month. Calculate it as total scheduled rent after concessions divided by lease months. Then account for vacancy loss separately: a building can advertise at the market rate while collecting less because units sit empty.
Rent-to-income is another unit-level measure. Divide annual rent by gross household income; a ratio above 30% is commonly treated as cost burdened. Across OECD countries, households spend between 10% and 33% of disposable income on housing; the 2019 median rent burden was 22%, compared with a 15% median mortgage burden for owner-occupiers with mortgages (OECD housing data). These figures use disposable income, so they are not directly interchangeable with a gross-income threshold. Apply the flag to individual households or units rather than the submarket average.
For a comparable-unit check, select five to ten recently leased homes with similar size, age, and location. Adjust for identifiable differences such as floor level, renovation year, parking, and outdoor space. Report the adjusted range, not just a midpoint, and compare it with effective rents and submarket supply. You can also compare rental trends across Zillow markets as an external cross-check, while keeping local concessions and supply conditions central to the analysis.
Model Pricing and Build a Report Decision-Makers Use
The simplest model that works is a comparable-based estimate. Adjust the rents of five to ten leased comparables for size, floor, age and amenities, then report the middle 50% of adjusted values as a target range. A single point estimate invites an argument about precision you can't win.
From comparables to a working model
For broader coverage, regress monthly rent on bedrooms, floor area, building age and neighbourhood indicators. Check every coefficient before you trust a forecast: a negative floor-area coefficient, or a neighbourhood dummy that flips sign between runs, means the cleaning step broke something and the model is fitting noise. For trends, use a 12-month rolling median plus a seasonal index, so a summer peak isn't read as growth and a January dip isn't read as a crash.
Then build three scenarios. Low, base and high, each tied to explicit assumptions about vacancy and new completions in that submarket. When the base case and the high case differ only by a percentage point, you've written one scenario three times.
Harvard's Joint Center for Housing Studies shows why the submarket split matters more than the national line. Apartment vacancy was highest in the South at 6.0% and the West at 4.9%, while the Northeast stayed tight at 3.8%, and Austin's apartment vacancy rate rose by five percentage points since 2021 after substantial construction while many Midwest markets stayed comparatively tight (JCHS 2026 State of the Nation's Housing). Falling rents can coexist with strong demand when completions outpace absorption, and modest growth in a supply-starved submarket signals scarcity rather than weakness.
What the report has to answer: where new supply is actually competing with existing units, and where demand is absorbing it. That question can't be answered by one market-wide rent trend.
Structure the deliverable tightly: a one-page summary carrying the decision and the recommendation, three charts (rent trend by submarket, vacancy against rent growth, concession share by building), a submarket comparison table, and a caveats section that names every data gap. That caveats section is what keeps the report credible six months later. When the deliverable needs to be a live dashboard instead of a PDF, this comparison of business intelligence tools covers the practical options.
For a single-detached rental rather than a 200-unit building, the logic narrows to one unit in one neighbourhood, and Royal LePage Brookside Realty rental pricing walks through that competitive-price exercise step by step.
Run a Pilot Neighbourhood Before You Scale
Pick one neighbourhood you know well and run all seven stages in two weeks. Use the three to five KPIs from your one-sentence question, the cleaning checks from the data step, and the median and comparable methods from the metrics step. Scale comes after proof, not before it.
Validate by predicting rents for ten listings that have already leased, then measure the gap between predicted and actual rent as a percentage of actual rent for each listing, and as an average across all ten. Under 5% average error is the bar before you extend to other neighbourhoods. If you're above it, go back to cleaning and comparables rather than adding more data, because more noise rarely fixes a biased method.
Scrappey's real estate solutions cover property listings, pricing and market trends, and mobile proxies with region targeting can narrow residential targeting below country level to a state or city, which is what a submarket pilot needs when the portal serves the whole country from one domain.
Then lock the operating rhythm:
- Weekly listing refresh, one row per listing, raw HTML retained.
- Monthly report with the three charts and the caveats section.
- Quarterly review of sources, licence terms and field definitions.
- One named owner for each of the three, because shared ownership means nobody checks the duplicates.
Your next action is small and immediate. Choose the pilot neighbourhood this week and write its KPI sheet before collecting a single listing.
Scrappey handles the collection layer this workflow depends on, from weekly listing snapshots to the regional targeting a submarket pilot needs, and our real estate solutions cover property listings, pricing and market trends so you're not rebuilding the same scripts for every portal. Point it at your pilot neighbourhood, run the two-week validation, and let the error number tell you whether your method is ready to scale. Visit Scrappey and start with the free trial, no card required.